Happy Chinese New Year 2025
Happy CNY 2025 🎉🧧!
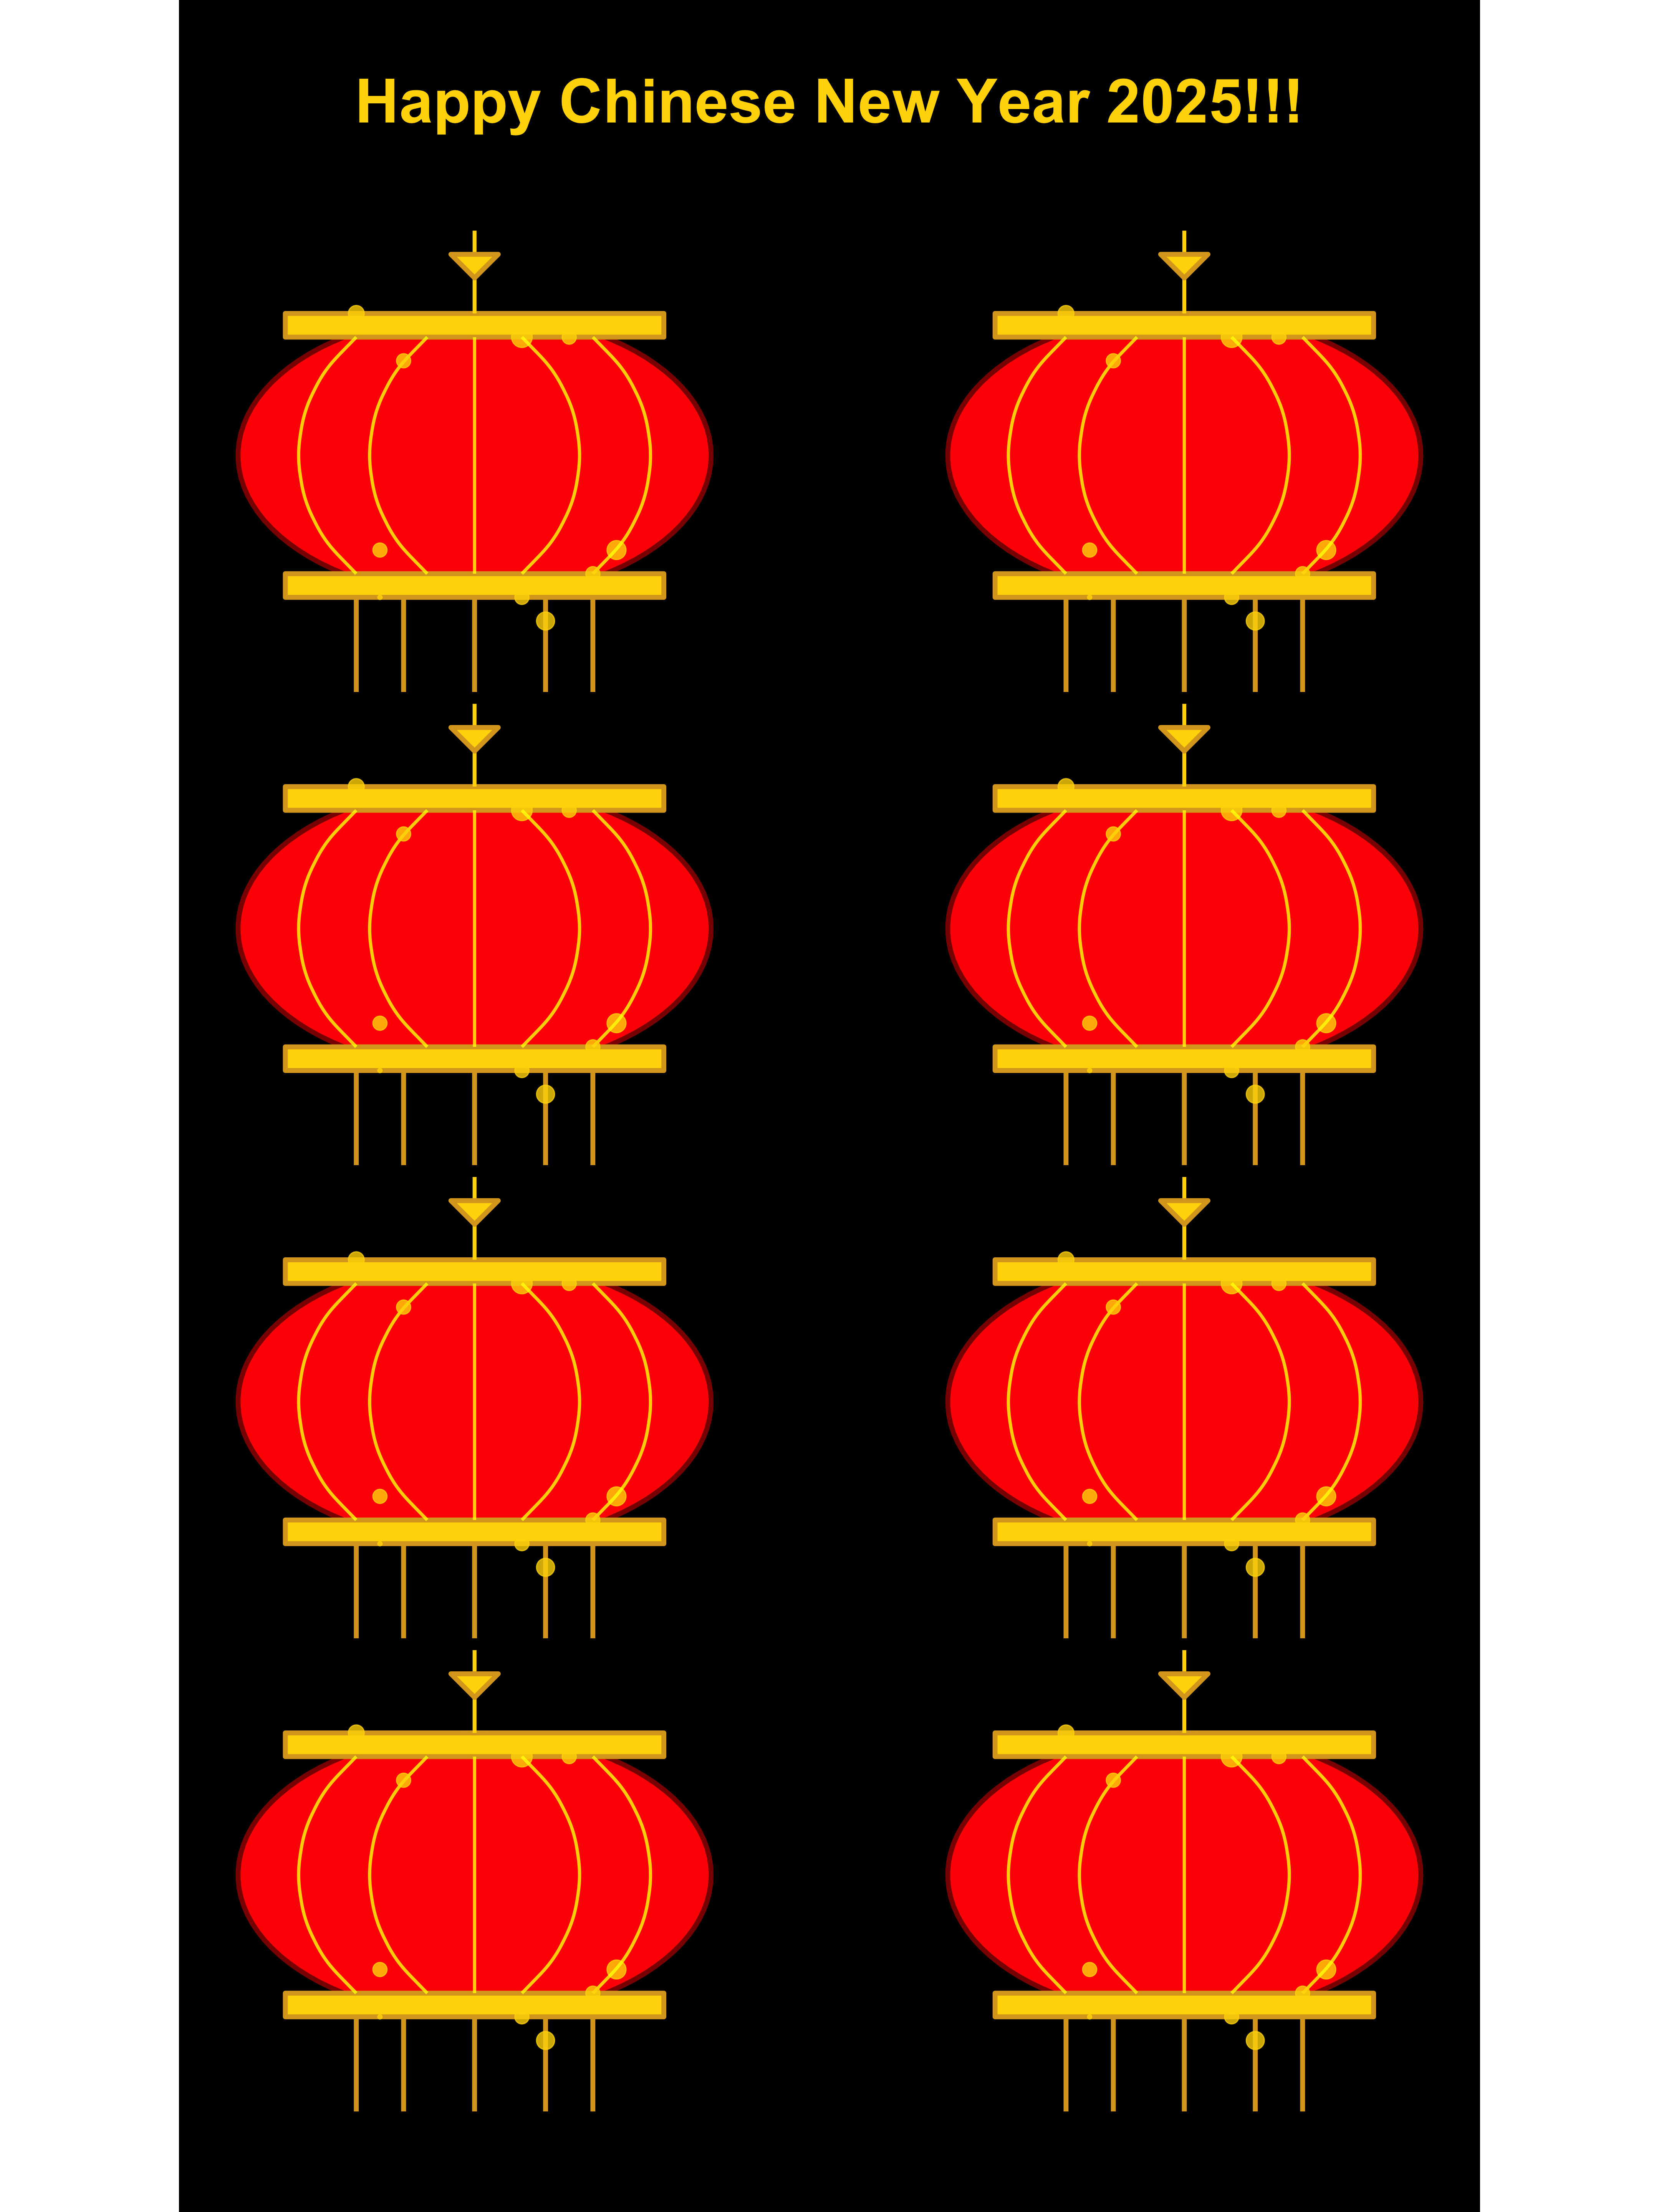
On my way to Hangzhou Xiaoshan International Airport for my return to Sydney, the streets were beautifully adorned with red lanterns 🏮 hanging from the streetlights. Inspired by this enchanting sight, I created the figure below in R during the trip. It definitely helped pass the time while I was waiting (endlessly) at the airport and enduring nearly 10 hours on the plane.
Wishing everyone a Happy Chinese New Year of the Snake 🐍 2025!🧨🎇🎉🧧
Source code for creating the above figure:
library(ggplot2)
library(dplyr)
library(tibble)
Step 1: Create a red lantern by coding all the components that make up the lantern.
lantern_body <- tibble(
  x = cos(seq(0, 2 * pi, length.out = 100)),
  y = sin(seq(0, 2 * pi, length.out = 100)) * 0.6 # Oval shape
)

# Decorative gold band at the top and bottom
gold_band_top <- tibble(
  x = c(-0.8, 0.8, 0.8, -0.8),
  y = c(0.6, 0.6, 0.5, 0.5)
)

gold_band_bottom <- tibble(
  x = c(-0.8, 0.8, 0.8, -0.8),
  y = c(-0.5, -0.5, -0.6, -0.6)
)

# Tassels at the bottom
tassels <- tibble(
  x = c(-0.5, -0.3, 0, 0.3, 0.5),
  xend = c(-0.5, -0.3, 0, 0.3, 0.5),
  y = rep(-0.6, 5),
  yend = rep(-1.0, 5)
)

# Hanging string at the top
hanging_string <- tibble(
  x = c(0, 0),
  y = c(0.6, 0.75)  # Longer hanging string for traditional look
)

# Chinese knot at the top
chinese_knot <- tibble(
  x = c(0, 0.1, -0.1, 0),
  y = c(0.75, 0.85, 0.85, 0.75)
)

# Star-like lights (small golden stars on the lantern)
stars <- tibble(
  x = c(0.2, -0.5, 0.6, -0.4, 0.3),
  y = c(0.5, 0.6, -0.4, -0.6, -0.7),
  size = c(2, 1.5, 1.8, 1, 1.7)
)

# Additional decorative curved lines on the lantern body
curved_lines <- tibble(
  x = c(0, 0.5, 1, 0.5, 0),
  y = c(0.3, 0.5, 0.3, -0.5, -0.7)
)

# More golden dots along the body of the lantern
dots <- tibble(
  x = c(-0.3, 0.4, -0.4, 0.5, 0.2),
  y = c(0.4, 0.5, -0.4, -0.5, -0.6)
)

# Adding vertical semi-circle curved lines
semi_circles_vertical <- tibble(
  x = c(-0.6, -0.4, 0, 0.4, 0.7),  # X positions for vertical curves
  y_start = rep(0.5, 5),  # Start at the top of the lantern
  y_end = rep(-0.5, 5),  # End at the bottom of the lantern
  curvature = c(-0.5, 0.5, -0.5, 0.5, -0.5)  # Same curvature for a semi-circle effect
)
Step 2: Create a function to arrange the positions (x and y) of multiple lanterns within a single figure.
create_lantern_layers <- function(offset_x = 0, offset_y = 0) {
  list(
    # Lantern body
    geom_polygon(
      data = lantern_body %>% mutate(x = x + offset_x, y = y + offset_y),
      aes(x = x, y = y),
      fill = "red", color = "darkred", size = 1.5
    ),
    # Gold band at the top
    geom_polygon(
      data = gold_band_top %>% mutate(x = x + offset_x, y = y + offset_y),
      aes(x = x, y = y),
      fill = "gold", color = "goldenrod", size = 1.5
    ),
    # Gold band at the bottom
    geom_polygon(
      data = gold_band_bottom %>% mutate(x = x + offset_x, y = y + offset_y),
      aes(x = x, y = y),
      fill = "gold", color = "goldenrod", size = 1.5
    ),
    # Tassels at the bottom
    geom_segment(
      data = tassels %>% mutate(x = x + offset_x, xend = xend + offset_x, y = y + offset_y, yend = yend + offset_y),
      aes(x = x, y = y, xend = xend, yend = yend),
      color = "goldenrod", size = 1.5
    ),
    # Hanging string
    geom_segment(
      data = hanging_string %>% mutate(x = x + offset_x, y = y + offset_y),
      aes(x = x, y = y, xend = x, yend = y + 0.2),
      color = "gold", size = 1.2
    ),
    # Chinese knot at the top
    geom_polygon(
      data = chinese_knot %>% mutate(x = x + offset_x, y = y + offset_y),
      aes(x = x, y = y),
      fill = "gold", color = "goldenrod", size = 1.5
    ),
    # Tiny stars/lights around the lantern
    geom_point(
      data = stars %>% mutate(x = x + offset_x, y = y + offset_y),
      aes(x = x, y = y, size = size),
      color = "gold", alpha = 0.8,
      show.legend = FALSE
    ),
    # Add vertical semi-circle curved lines on the lantern body
    geom_curve(
      aes(x = offset_x - 0.5, y = offset_y + 0.5, xend = offset_x - 0.5, yend = offset_y - 0.5),
      curvature = 0.5, color = "yellow", size = 1, alpha = 0.8
    ),
    geom_curve(
      aes(x = offset_x - 0.2, y = offset_y + 0.5, xend = offset_x - 0.2, yend = offset_y - 0.5),
      curvature = 0.5, color = "yellow", size = 1, alpha = 0.8
    ),
    geom_curve(
      aes(x = offset_x, y = offset_y + 0.5, xend = offset_x, yend = offset_y - 0.5),
      curvature = 0, color = "yellow", size = 1, alpha = 0.8
    ),
    geom_curve(
      aes(x = offset_x + 0.2, y = offset_y + 0.5, xend = offset_x + 0.2, yend = offset_y - 0.5),
      curvature = -0.5, color = "yellow", size = 1, alpha = 0.8
    ),
    geom_curve(
      aes(x = offset_x + 0.5, y = offset_y + 0.5, xend = offset_x + 0.5, yend = offset_y - 0.5),
      curvature = -0.5, color = "yellow", size = 1, alpha = 0.8
    ),
    # Dots along the lantern body
    geom_point(
      data = dots %>% mutate(x = x + offset_x, y = y + offset_y),
      aes(x = x, y = y),
      color = "gold", size = 4, alpha = 0.8
    )
  )
}
Step 3: Combine all lanterns into a single plot.
lanterns_plot <- ggplot() +
  # Add eight lanterns with different offsets
  create_lantern_layers(-1.5, 1) +
  create_lantern_layers(1.5, 1) +
  create_lantern_layers(-1.5, -1) +
  create_lantern_layers(1.5, -1) +
  create_lantern_layers(-1.5, -3) +
  create_lantern_layers(1.5, -3) +
  create_lantern_layers(-1.5, -5) +
  create_lantern_layers(1.5, -5) +
  # Fixed axis and black background
  coord_fixed() +
  theme_void() +
  theme(panel.background = element_rect(fill = "black")) +
  # Add the "Happy Chinese New Year!" message at the top
  annotate("text", x = 0, y = 2.5, label = "Happy Chinese New Year 2025!!!", size = 14, color = "gold", fontface = "bold", hjust = 0.5)